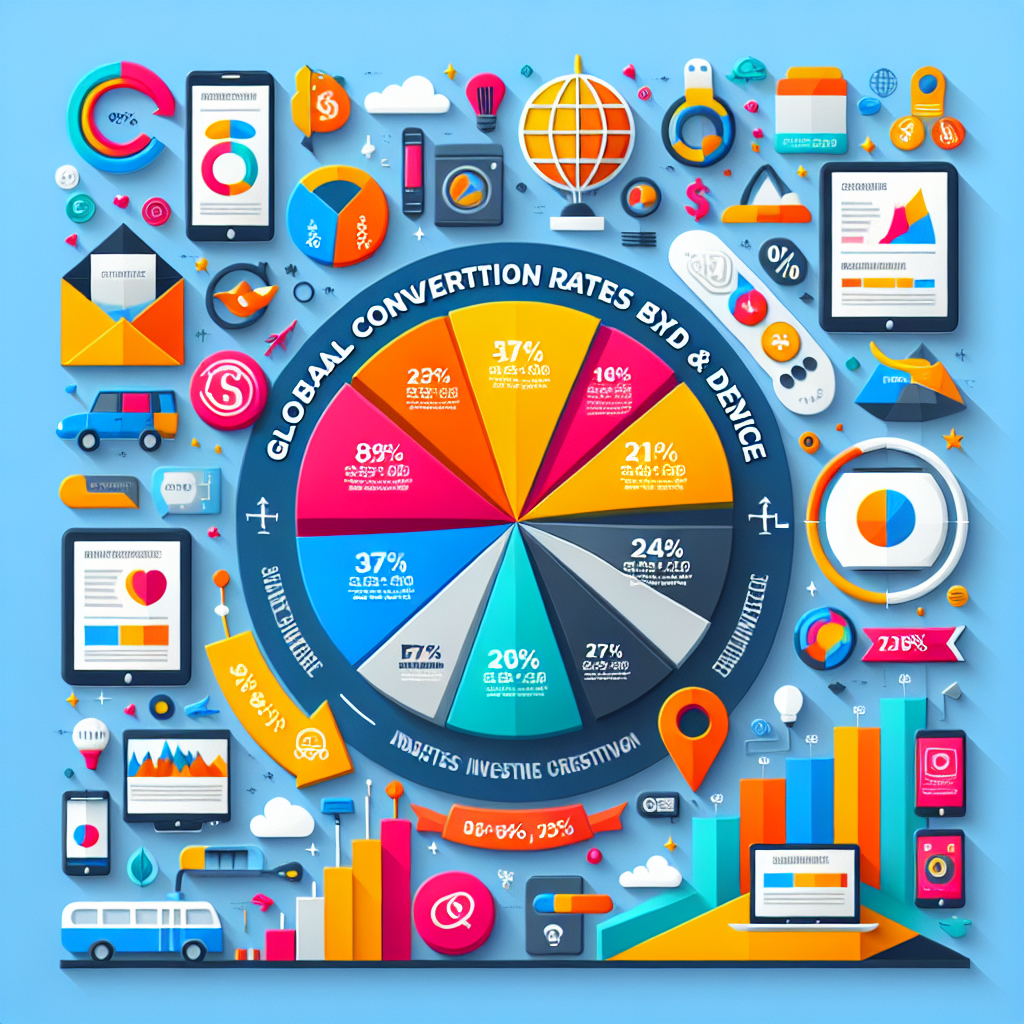
Universal Conversion Rates by Industry: Insights for 2024
As businesses strive to improve their online presence and maximize revenue, understanding conversion rates across various industries becomes critical. With the ever-evolving landscape of digital marketing and e-commerce, knowing where you stand compared to your competitors helps inform strategic decisions. This blog post dives into global conversion rates by industry, offering insights for 2024 to help you tailor your strategies effectively.
Understanding Conversion Rates
A conversion rate is the percentage of users who take a desired action on your website or app, such as making a purchase, signing up for a newsletter, or completing a contact form. High conversion rates are often indicative of effective marketing strategies, user-friendly website design, and engaging content.
Conversion rates can significantly vary by industry, the type of device used (desktop or mobile), and other factors affecting user behavior. Keeping abreast of these trends allows businesses to optimize their conversion funnels.
Key Factors Influencing Conversion Rates
Before diving into specific conversion rates by industry, let’s consider some of the primary factors that can affect these metrics:
Global Conversion Rate Insights by Industry for 2024
According to a survey conducted by Statista, conversion rates fluctuate significantly across different sectors and devices. Here’s a breakdown of notable findings for 2024:
1. E-commerce
Historically, e-commerce has seen some of the highest conversion rates, especially during the holiday seasons. In 2024, the average conversion rate for e-commerce is projected to be around 2.5% globally for desktop users and approximately 1.6% for mobile users.
2. Travel and Hospitality
Travel and hospitality websites have fluctuating conversion rates, typically averaging around 1.8% for desktop users and 1.3% for mobile users.
3. Finance and Insurance
Finance-related websites consistently demonstrate higher conversion rates, with desktop users averaging around 5.5% and mobile users around 3.2%. This can be attributed to the need for thorough information and user trust in these services.
4. B2B Services
B2B services usually have lower conversion rates, averaging around 2.0% for desktop and 1.5% for mobile devices. The longer sales cycles in this sector often contribute to the differences in conversion metrics.
5. Retail
Retail websites have a conversion rate of approximately 2.1% for desktop and 1.7% for mobile. Despite competition growing fiercer in online retail, strategic marketing methods can help capture and convert website visitors.
6. Health and Wellness
The health sector generally averages a 2.3% conversion rate for desktops and 1.9% for mobile users. This indicates a growing demand for online health and wellness services, particularly post-pandemic.
Device Impact on Conversion Rates
An important aspect worth noting is how device type influences conversion rates.
As mobile traffic continues to grow, businesses must ensure their websites are optimized for mobile devices, transforming the user experience into one that encourages conversions.
Strategies to Increase Your Conversion Rates
Implementing the following strategies can help improve your overall conversion rates, regardless of your industry:
Conclusion
As we look to 2024, understanding industry-specific conversion rates and the factors influencing them is vital for any business engaged in digital marketing. By implementing the insights and strategies outlined in this post, businesses can improve user experiences and drive higher conversion rates across their digital platforms. Ensure you monitor these trends and adapt to the evolving marketplace to stay competitive.


